Next Generation 2D Electrophoresis
|
|
|
|
|
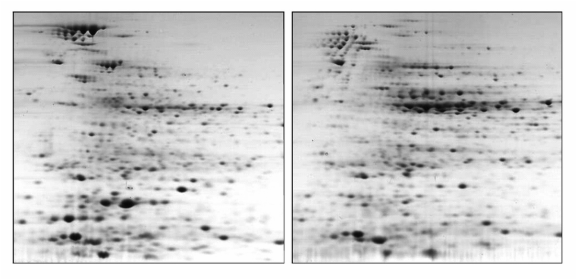
Figure 1.Sample preparation is critical to meaningful 2D results. Rhodopseudomonas palustris cells were divided equally and one half (left) was processed in 7M urea, 2M thiourea, 25 mM C7BZO and the other half (right) was processed in CytoBuster reagent. The latter reagent was optimized for the recovery of recombinant proteins, and therefore, exhibits bias towards cytoplasmic proteins. Membrane proteins are more accurately represented in left gel while cytoplasmic proteins are overrepresented in the right gel.
|
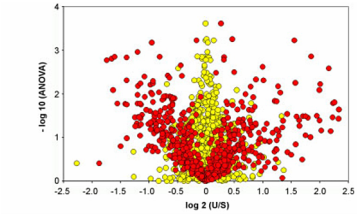
Figure 2.Protein expression analysis and statistical significance of image analysis of protein expression. Volcano plot illustrates the significance of differences in spot fluorescence in replicate 2D gels comparing stabilized (U) and unstabilized (S) phosphoproteins (red). Fold difference in 595 matched spots in 2D gels were plotted on the abscissa. Significance is expressed on the ordinate as the negative log of the ANOVA value. Gel reproducibility (yellow) is represented by comparison of replicate gels and their close adherence to the expected 1:1 ratio.
|
|